Interesting and related publications, now appearing in pairs…
1. The Irish DNA Atlas: Revealing Fine-Scale Population Structure and History within Ireland, by Gilbert et al., in Scientific Reports (2017).
Abstract:
The extent of population structure within Ireland is largely unknown, as is the impact of historical migrations. Here we illustrate fine-scale genetic structure across Ireland that follows geographic boundaries and present evidence of admixture events into Ireland. Utilising the ‘Irish DNA Atlas’, a cohort (n = 194) of Irish individuals with four generations of ancestry linked to specific regions in Ireland, in combination with 2,039 individuals from the Peoples of the British Isles dataset, we show that the Irish population can be divided in 10 distinct geographically stratified genetic clusters; seven of ‘Gaelic’ Irish ancestry, and three of shared Irish-British ancestry. In addition we observe a major genetic barrier to the north of Ireland in Ulster. Using a reference of 6,760 European individuals and two ancient Irish genomes, we demonstrate high levels of North-West French-like and West Norwegian-like ancestry within Ireland. We show that that our ‘Gaelic’ Irish clusters present homogenous levels of ancient Irish ancestries. We additionally detect admixture events that provide evidence of Norse-Viking gene flow into Ireland, and reflect the Ulster Plantations. Our work informs both on Irish history, as well as the study of Mendelian and complex disease genetics involving populations of Irish ancestry.
2. New preprint on BioRxiv, Insular Celtic population structure and genomic footprints of migration, by Byrne, Martiniano et al. (2017).
Abstract:
Previous studies of the genetic landscape of Ireland have suggested homogeneity, with population substructure undetectable using single-marker methods. Here we have harnessed the haplotype-based method fineSTRUCTURE in an Irish genome-wide SNP dataset, identifying 23 discrete genetic clusters which segregate with geographical provenance. Cluster diversity is pronounced in the west of Ireland but reduced in the east where older structure has been eroded by historical migrations. Accordingly, when populations from the neighbouring island of Britain are included, a west-east cline of Celtic-British ancestry is revealed along with a particularly striking correlation between haplotypes and geography across both islands. A strong relationship is revealed between subsets of Northern Irish and Scottish populations, where discordant genetic and geographic affinities reflect major migrations in recent centuries. Additionally, Irish genetic proximity of all Scottish samples likely reflects older strata of communication across the narrowest inter-island crossing. Using GLOBETROTTER we detected Irish admixture signals from Britain and Europe and estimated dates for events consistent with the historical migrations of the Norse-Vikings, the Anglo-Normans and the British Plantations. The influence of the former is greater than previously estimated from Y chromosome haplotypes. In all, we paint a new picture of the genetic landscape of Ireland, revealing structure which should be considered in the design of studies examining rare genetic variation and its association with traits.
Here are some interesting excerpts (emphasis mine):
Population structure in Ireland
The geographical distribution of this deep subdivision of Leinster resembles pre-Norman territorial boundaries which divided Ireland into fifths (cúige), with north Leinster a kingdom of its own known as Meath (Mide) [15]. However interpreted, the firm implication of the observed clustering is that despite its previously reported homogeneity, the modern Irish population exhibits genetic structure that is subtly but detectably affected by ancestral population structure conferred by geographical distance and, possibly, ancestral social structure.
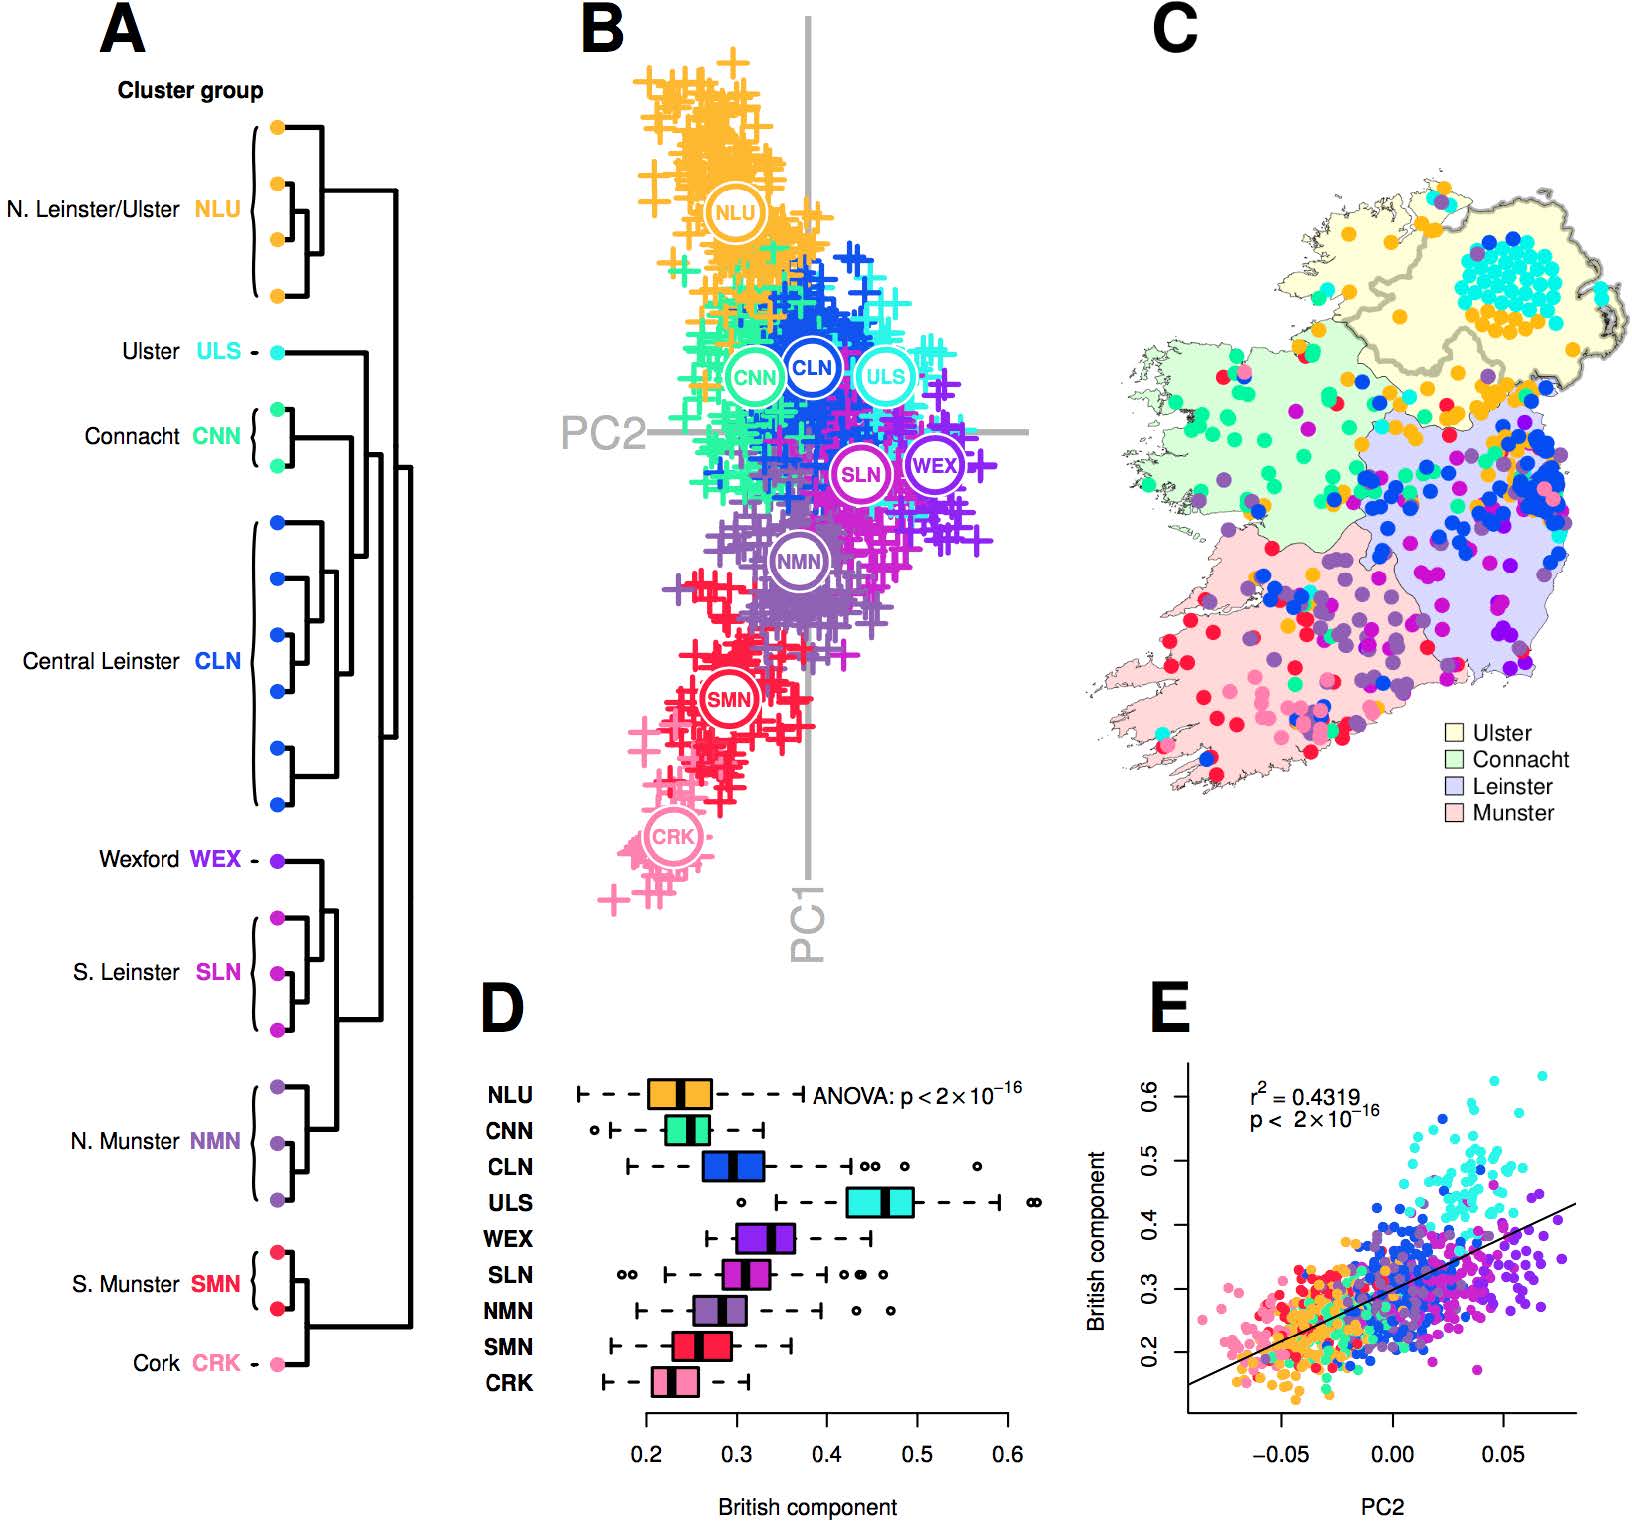
ChromoPainter PC1 demonstrated high diversity amongst clusters from the west coast, which may be attributed to longstanding residual ancient (possibly Celtic) structure in regions largely unaffected by historical migration. Alternatively, genetic clusters may also have diverged as a consequence of differential influence from outside populations. This diversity between western genetic clusters cannot be explained in terms of geographic distance alone.
In contrast to the west of Ireland, eastern individuals exhibited relative homogeneity; (…) The overall pattern of western diversity and eastern homogeneity in Ireland may be explained by increased gene flow and migration into and across the east coast of Ireland from geographically proximal regions, the closest of which is the neighbouring island of Britain.
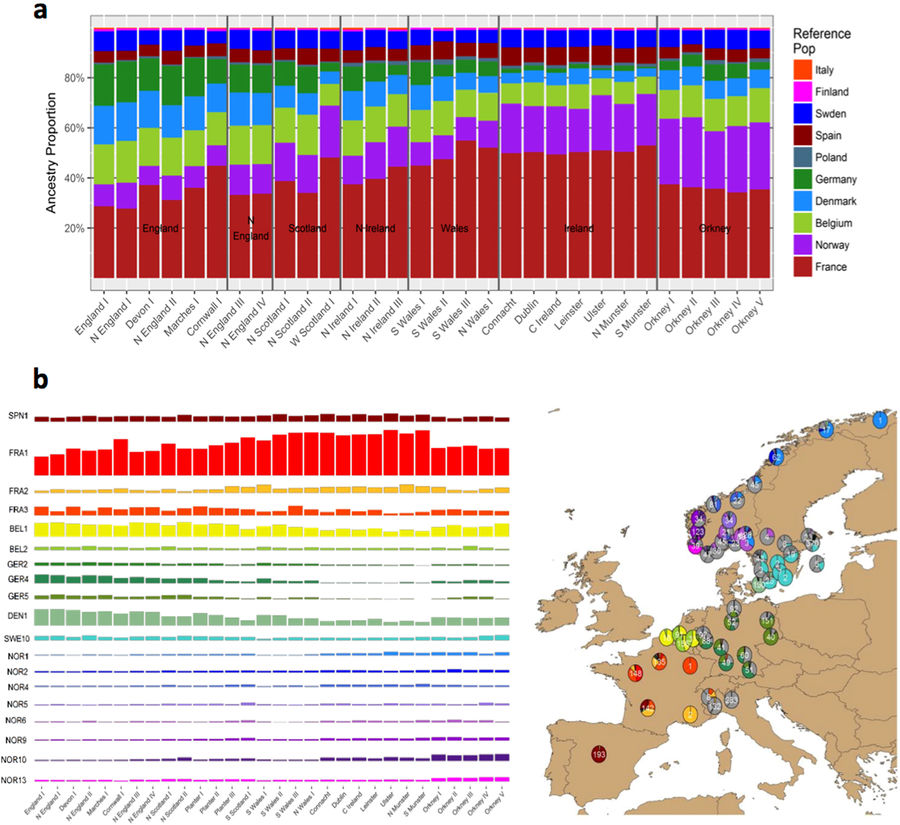
Analysis of variance of the British admixture component in cluster groups showed a significant difference (p < 2×10-16), indicating a role for British Anglo-Saxon admixture in distinguishing clusters, and ChromoPainter PC2 was correlated with the British component (p < 2×10-16), explaining approximately 43% of the variance. PC2 therefore captures an east to west Anglo-Celtic cline in Irish ancestry. This may explain the relative eastern homogeneity observed in Ireland, which could be a result of the greater English influence in Leinster and the Pale during the period of British rule in Ireland following the Norman invasion, or simply geographic proximity of the Irish east coast to Britain. Notably, the Ulster cluster group harboured an exceptionally large proportion of the British component (Fig 1D and 1E), undoubtedly reflecting the strong influence of the Ulster Plantations in the 17th century and its residual effect on the ethnically British population that has remained.
On the genetic structure of the British Isles
The genetic substructure observed in Ireland is consistent with long term geographic diversification of Celtic populations and the continuity shown between modern and Early Bronze Age Irish people
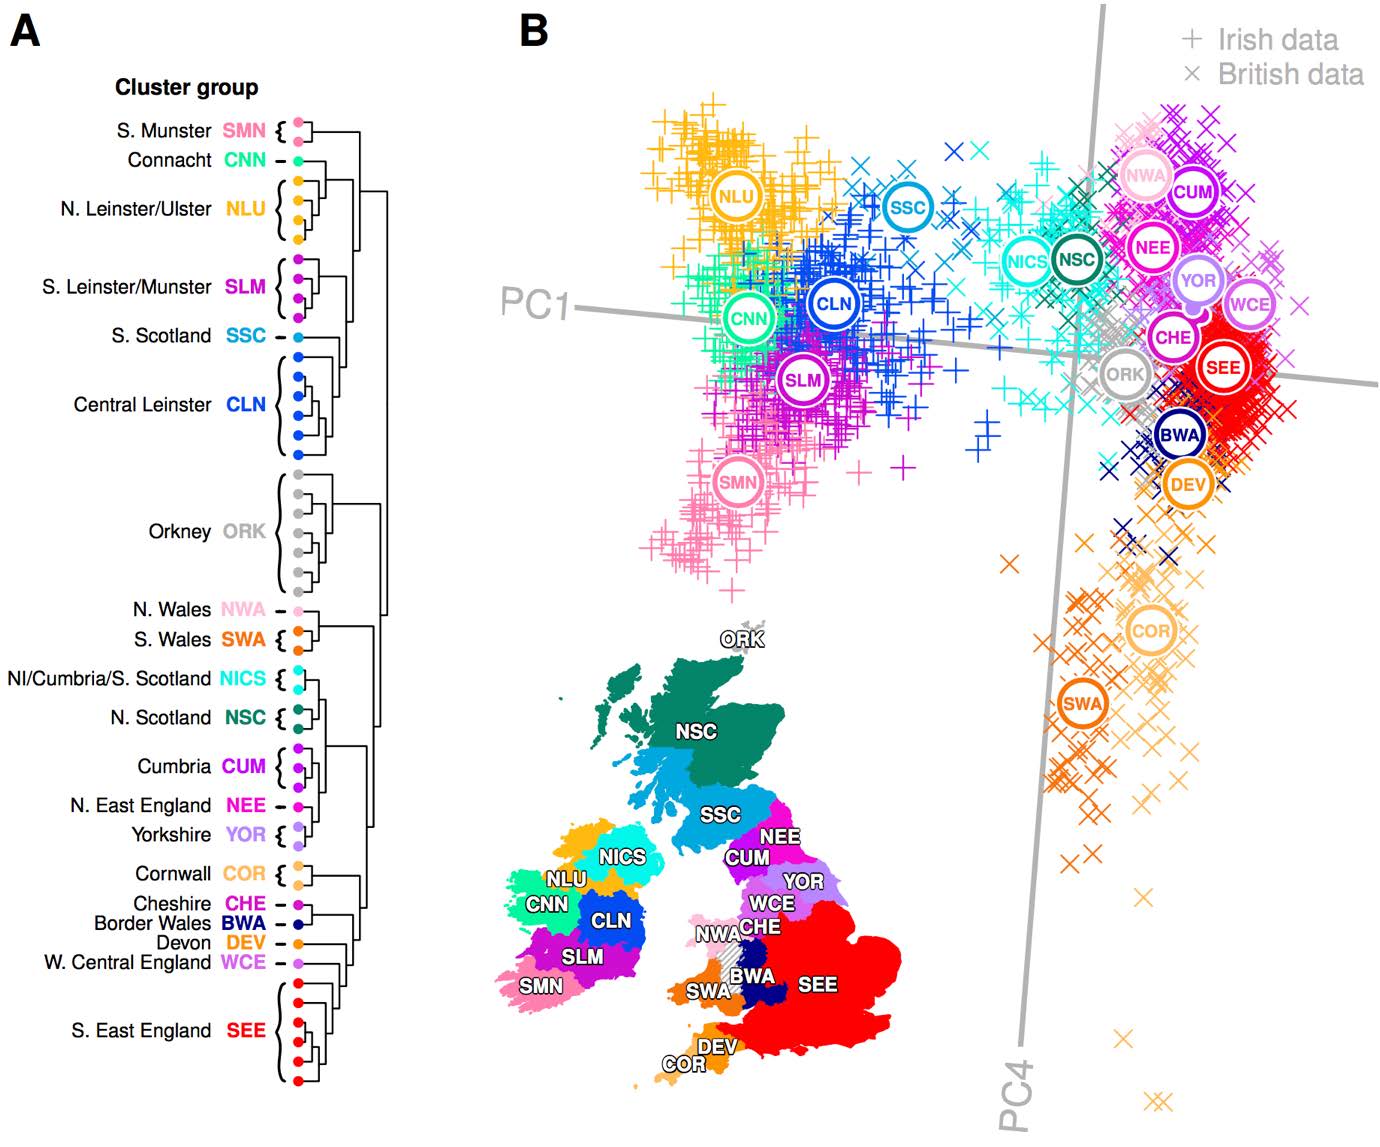
Clusters representing Celtic populations harbouring less Anglo-Saxon influence separate out above and below SEE on PC4. Notably, northern Irish clusters (NLU), Scottish (NISC, SSC and NSC), Cumbria (CUM) and North Wales (NWA) all separate out at a mutually similar level, representing northern Celtic populations. The southern Celtic populations Cornwall (COR), south Wales (SWA) and south Munster (SMN) also separate out on similar levels, indicating some shared haplotypic variation between geographically proximate Celtic populations across both Islands. It is notable that after the split of the ancestrally divergent Orkney, successive ChromoPainter PCs describe diversity in British populations where “Anglo-saxonization” was repelled [22]. PC3 is dominated by Welsh variation, while PC4 in turn splits North and South Wales significantly, placing south Wales adjacent to Cornwall and north Wales at the other extreme with Cumbria, all enclaves where Brittonic languages persisted.
In an interesting symmetry, many Northern Irish samples clustered strongly with southern Scottish and northern English samples, defining the Northern Irish/Cumbrian/Scottish (NICS) cluster group. More generally, by modelling Irish genomes as a linear mixture of haplotypes from British clusters, we found that Scottish and northern English samples donated more haplotypes to clusters in the north of Ireland than to the south, reflecting an overall correlation between Scottish/north English contribution and ChromoPainter PC1 position in Fig 1 (Linear regression: p < 2×10-16, r2 = 0.24).
North to south variation in Ireland and Britain are therefore not independent, reflecting major gene flow between the north of Ireland and Scotland (Fig 5) which resonates with three layers of historical contacts. First, the presence of individuals with strong Irish affinity among the third generation PoBI Scottish sample can be plausibly attributed to major economic migration from Ireland in the 19th and 20th centuries [6]. Second, the large proportion of Northern Irish who retain genomes indistinguishable from those sampled in Scotland accords with the major settlements (including the Ulster Plantation) of mainly Scottish farmers following the 16th Century Elizabethan conquest of Ireland which led to these forming the majority of the Ulster population. Third, the suspected Irish colonisation of Scotland through the Dál Riata maritime kingdom, which expanded across Ulster and the west coast of Scotland in the 6th and 7th centuries, linked to the introduction and spread of Gaelic languages [3]. Such a migratory event could work to homogenise older layers of Scottish population structure, in a similar manner as noted on the east coasts of Britain and Ireland. Earlier communications and movements across the Irish Sea are also likely, which at its narrowest point separates Ireland from Scotland by approximately 20 km.
Genomic footprints of migration into Ireland
Quite interesting is that it is haplogroups, and not admixture, that which defines the oldest migration layers into Ireland. Without evidence of paternal Y-DNA lineages we would probably not be able to ascertain the oldest migrations and languages broght by migrants, including Celtic languages:
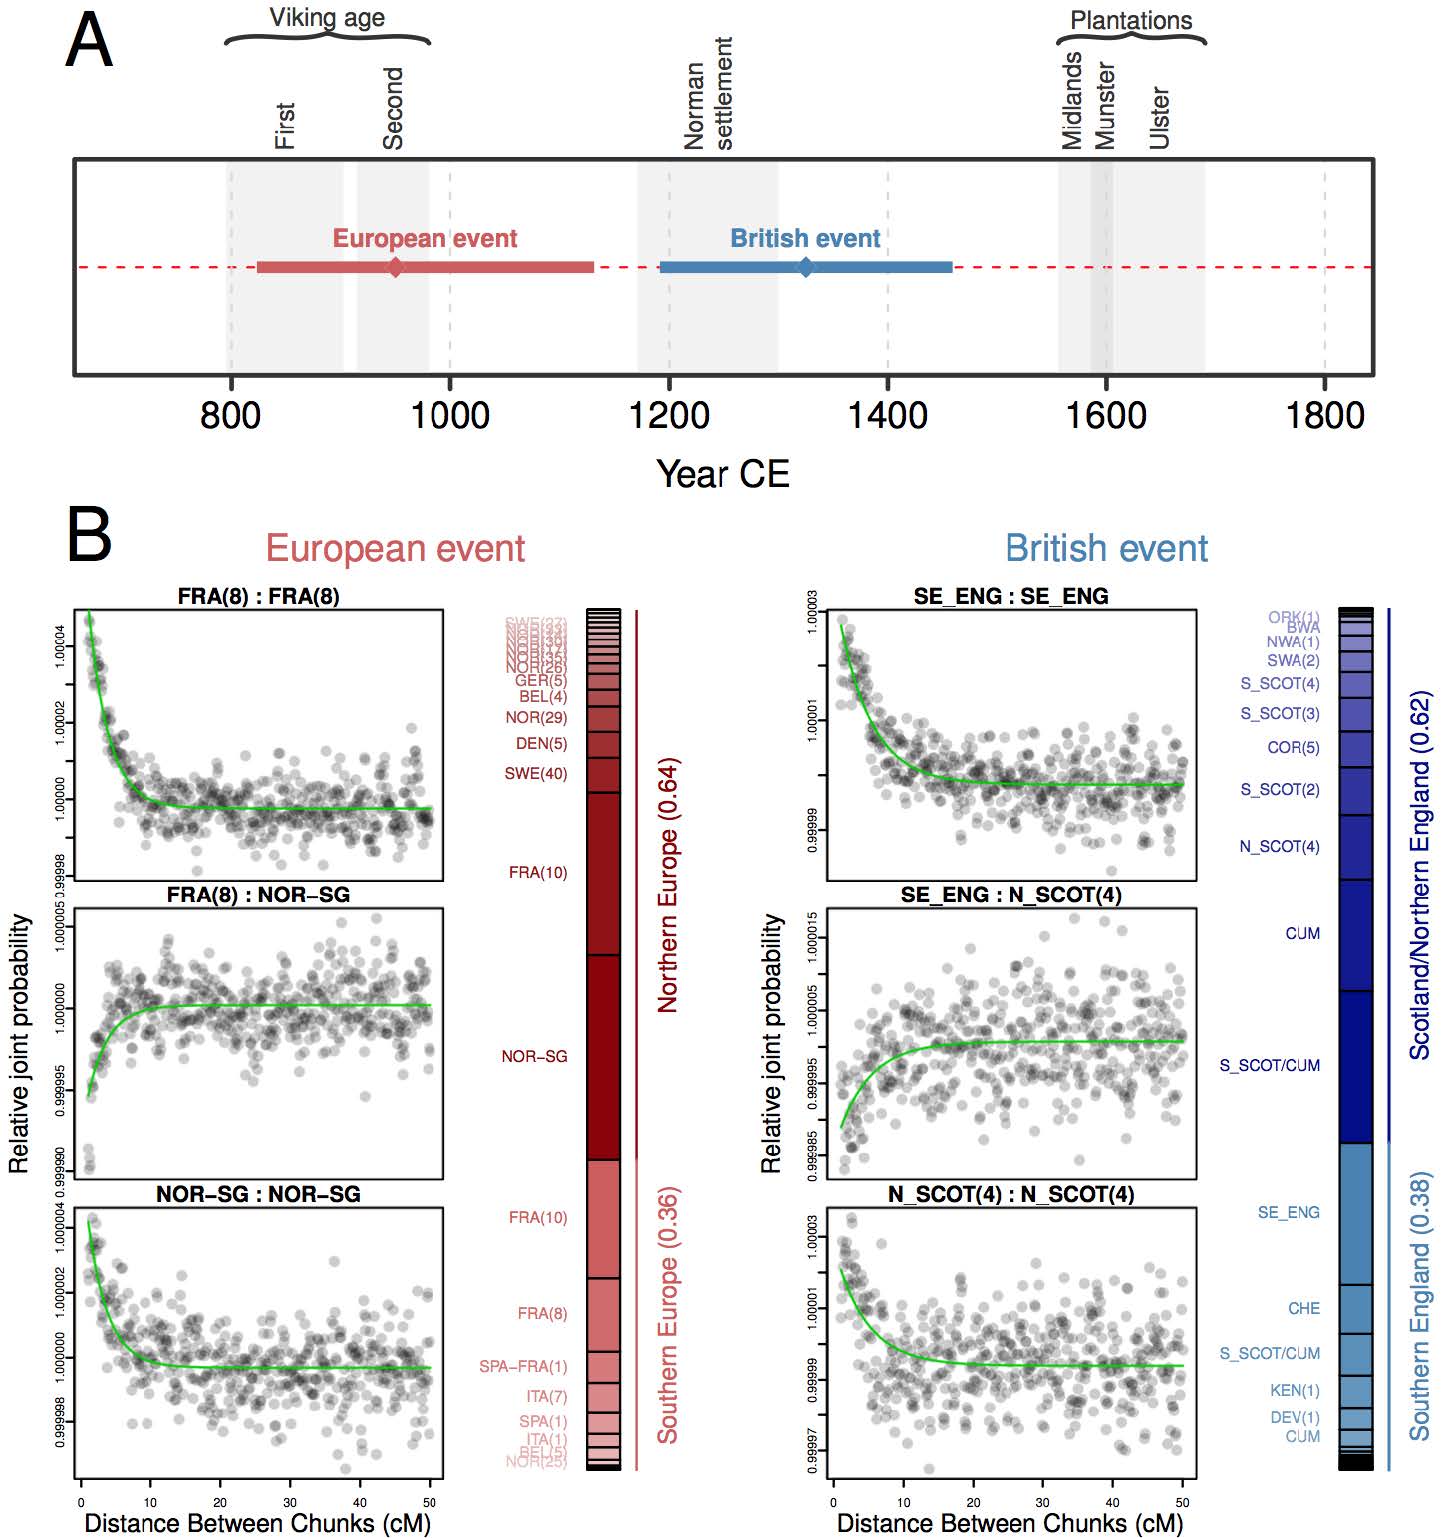
Of all the European populations considered, ancestral influence in Irish genomes was best represented by modern Scandinavians and northern Europeans, with a significant single-date one-source admixture event overlapping the historical period of the Norse-Viking settlements in Ireland (p < 0.01; fit quality FQB > 0.985; Fig 6). (…) This suggests a contribution of historical Viking settlement to the contemporary Irish genome and contrasts with previous estimates of Viking ancestry in Ireland based on Y chromosome haplotypes, which have been very low [25]. The modern-day paucity of Norse-Viking Y chromosome haplotypes may be a consequence of drift with the small patrilineal effective population size, or could have social origins with Norse males having less influence after their military defeat and demise as an identifiable community in the 11th century, with persistence of the autosomal signal through recombination.
European admixture date estimates in northwest Ulster did not overlap the Viking age but did include the Norman period and the Plantations
The genetic legacies of the populations of Ireland and Britain are therefore extensively intertwined and, unlike admixture from northern Europe, too complex to model with GLOBETROTTER.
Another study that strengthens the need to ascertain haplogroup-admixture differences between Yamna/Bell Beaker and Sredni Stog/Corded Ware.
Text and images from preprint article under a CC-BY-NC-ND 4.0 International license.
Featured image, from the article on Science Reports: The clustering of individuals with Irish and British ancestry based solely on genetics. Shown are 30 clusters identified by fineStructure from 2,103 Irish and British individuals. The dendrogram (left) shows the tree of clusters inferred by fineStructure and the map (right) shows the geographic origin of 192 Atlas Irish individuals and 1,611 British individuals from the Peoples of the British Isles (PoBI) cohort, labelled according to fineStructure cluster membership. Individuals are placed at the average latitude and longitude of either their great-grandparental (Atlas) or grandparental (PoBI) birthplaces. Great Britain is separated into England, Scotland, and Wales. The island of Ireland is split into the four Provinces; Ulster, Connacht, Leinster, and Munster. The outline of Britain was sourced from Global Administrative Areas (2012). GADM database of Global Administrative Areas, version 2.0. www.gadm.org. The outline of Ireland was sourced from Open Street Map Ireland, Copyright OpenStreetMap Contributors, (https://www.openstreetmap.ie/) – data available under the Open Database Licence. The figure was plotted in the statistical software language R46, version 3.4.1, with various packages.
Related:
- Indo-European demic diffusion model, 3rd edition (revised October 2017)
- Analysis of R1b-DF27 haplogroups in modern populations adds new information that contrasts with ‘steppe admixture’ results
- Neolithic and Bronze Age Basque-speaking Iberians resisted invaders from the steppe
- Something is very wrong with models based on the so-called ‘steppe admixture’ – and archaeologists are catching up
- Heyd, Mallory, and Prescott were right about Bell Beakers